Article · Data visualization
The Journey of Designing an Effective Visualization
How a static ‘Top Risk Objects’ table became the Object Risk Map — an interactive scatterplot for discovering and investigating data security risk.
Overview
Crafting elegant and functional data visualizations is a crucial skill for any product designer.
Not only does it enhance one’s understanding of color theory, intuitive interactions, and scalable design, but also sharpens one’s ability as a product thinker, requiring deep consideration of user goals and motivations.
In this blog, I’ll walk you through a real-life example from my work at Rubrik, where we transformed a static, unhelpful widget into a dynamic, action-driven visualization that significantly enhances discovery and investigation of security threats.
Challenge
Taking on the challenge
Last year, I was deep in the redesign of Rubrik’s Data Security Posture app — a tool that helps customers find sensitive data, see how it’s exposed, and track activity around it. Our product and design leaders set a clear direction: focus on real use cases, define tangible outcomes, and strengthen data security through actionable visualizations and insights.
To bring that vision to life, we worked closely across product, design, and engineering — staying in sync to ensure every visualization tied back to users’ goals.
Problem
A closer look: transforming the ‘Top Risk Objects’ widget
One redesign that really stands out is that of the ‘Top Risk Objects’ widget on the dashboard. Initially, it was just a simple table sorted by the amount of sensitive data present in the customer’s environment. This is what it looked like:
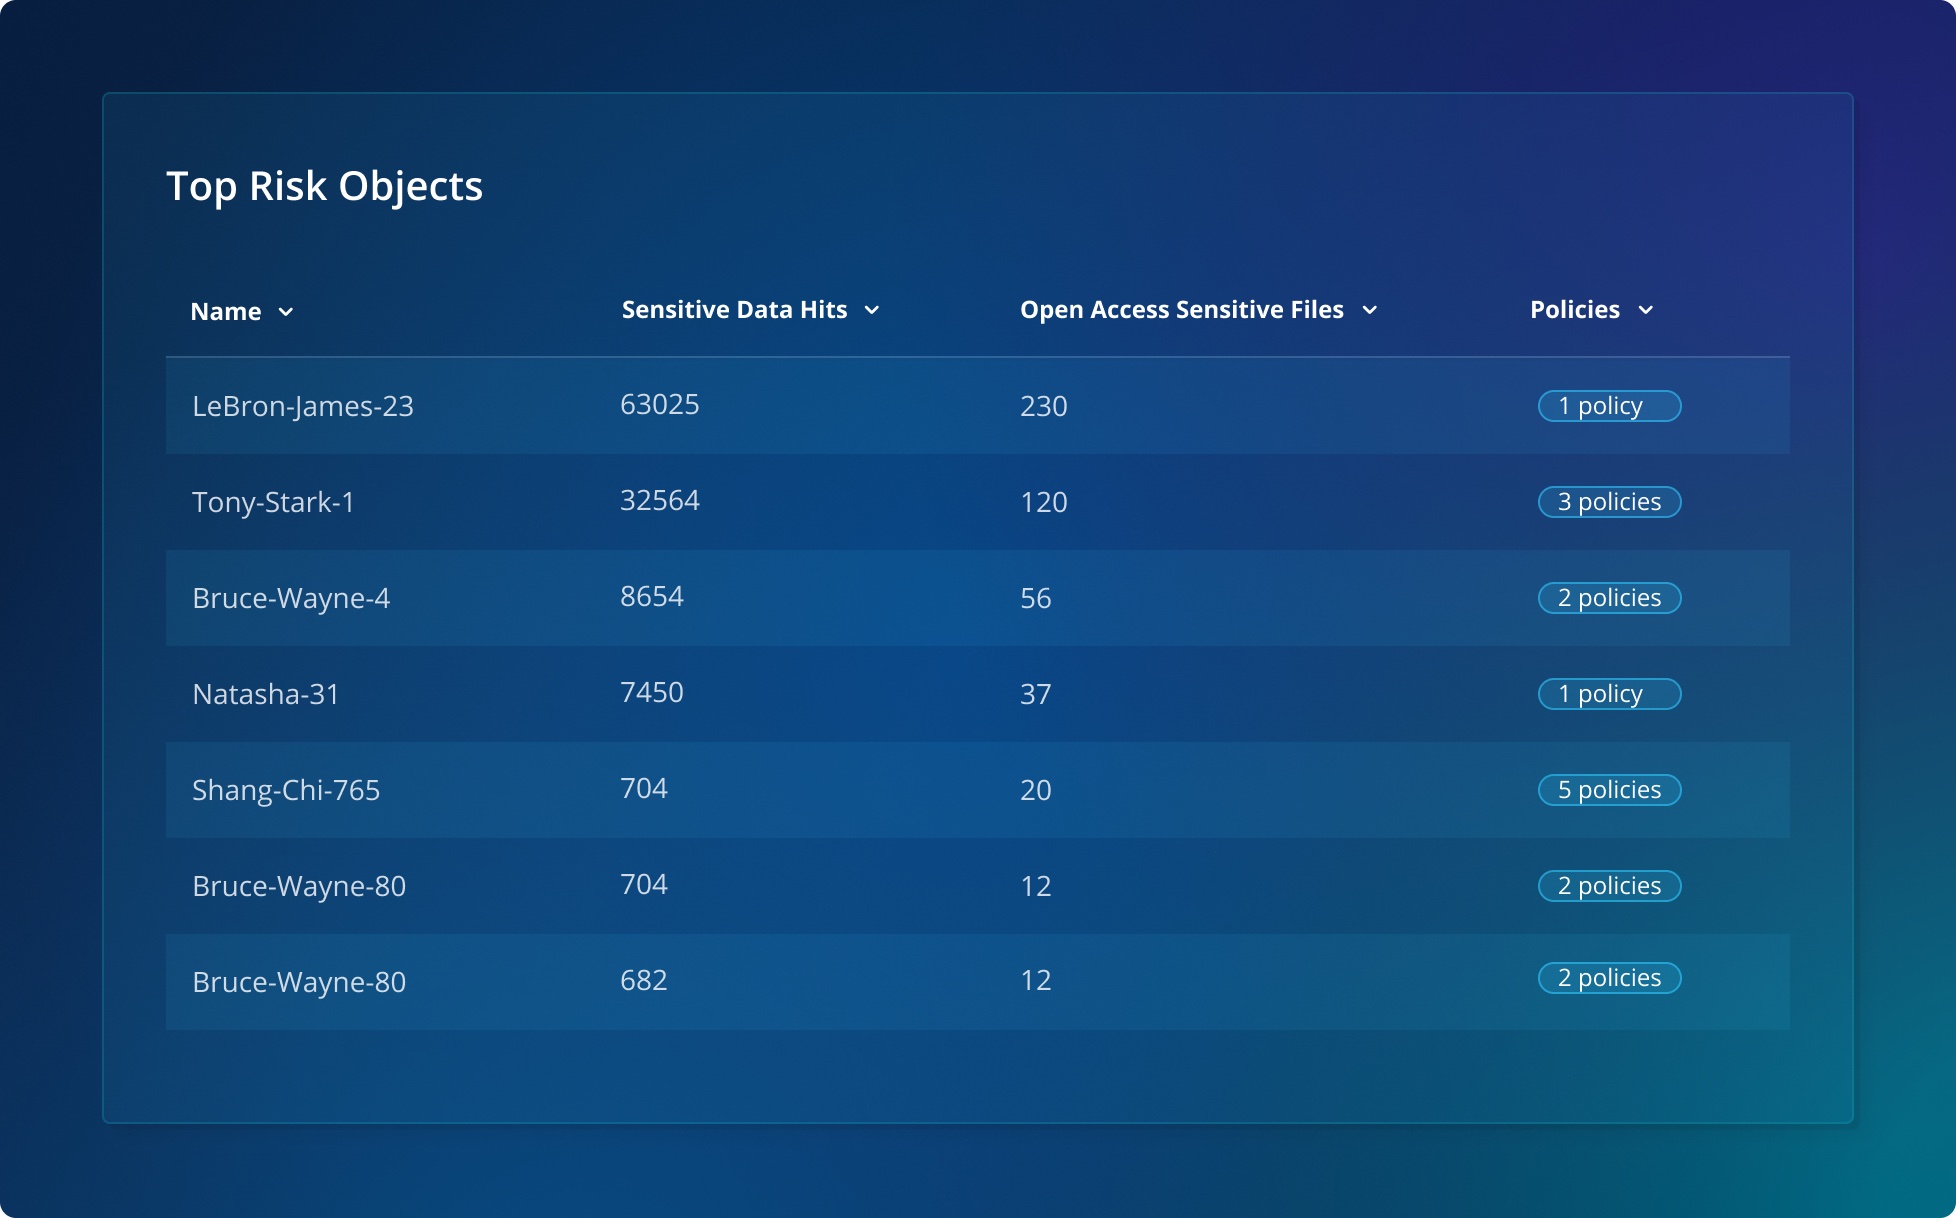
Users could drill down into each of the top risk objects to view more details; however, as we spoke with stakeholders, we realized this widget fell short in several key areas:
- It lacked a crucial metric for determining object risk: User Access. If an object has a lot of sensitive information but no users have access to it, the risk is low. Conversely, if many users have access to the same object, the chances of that sensitive information being exfiltrated are significantly higher; hence the risk is higher. Without it, object risk is meaningless.
- Since data objects typically don’t experience significant changes in their assets, most of the top risk objects remained static over time, making the current view neither actionable nor dynamic.
- The list only displayed the highest-risk objects, overlooking those that were growing rapidly in risk — an equally critical aspect for proactive investigation.
Goals
Setting new goals
Based on this feedback, we rethought our approach and set out concrete goals for the new visualization:
- Accurate risk representation
Factor in both object sensitivity and user access to give a true depiction of risk.
- Identify objects growing in risk
Help users easily spot objects that are increasing in risk, whether due to growing amounts of sensitive data or a rising number of users with access to the data.
- Prioritize investigation targets
Make it straightforward for users to see which objects they should prioritize during their investigations.
- Enable detailed investigations
Offer straightforward ways for users to drill down and investigate further into specific objects.
Process
Crafting the visualization
Exploring visualization options to provide an accurate risk representation
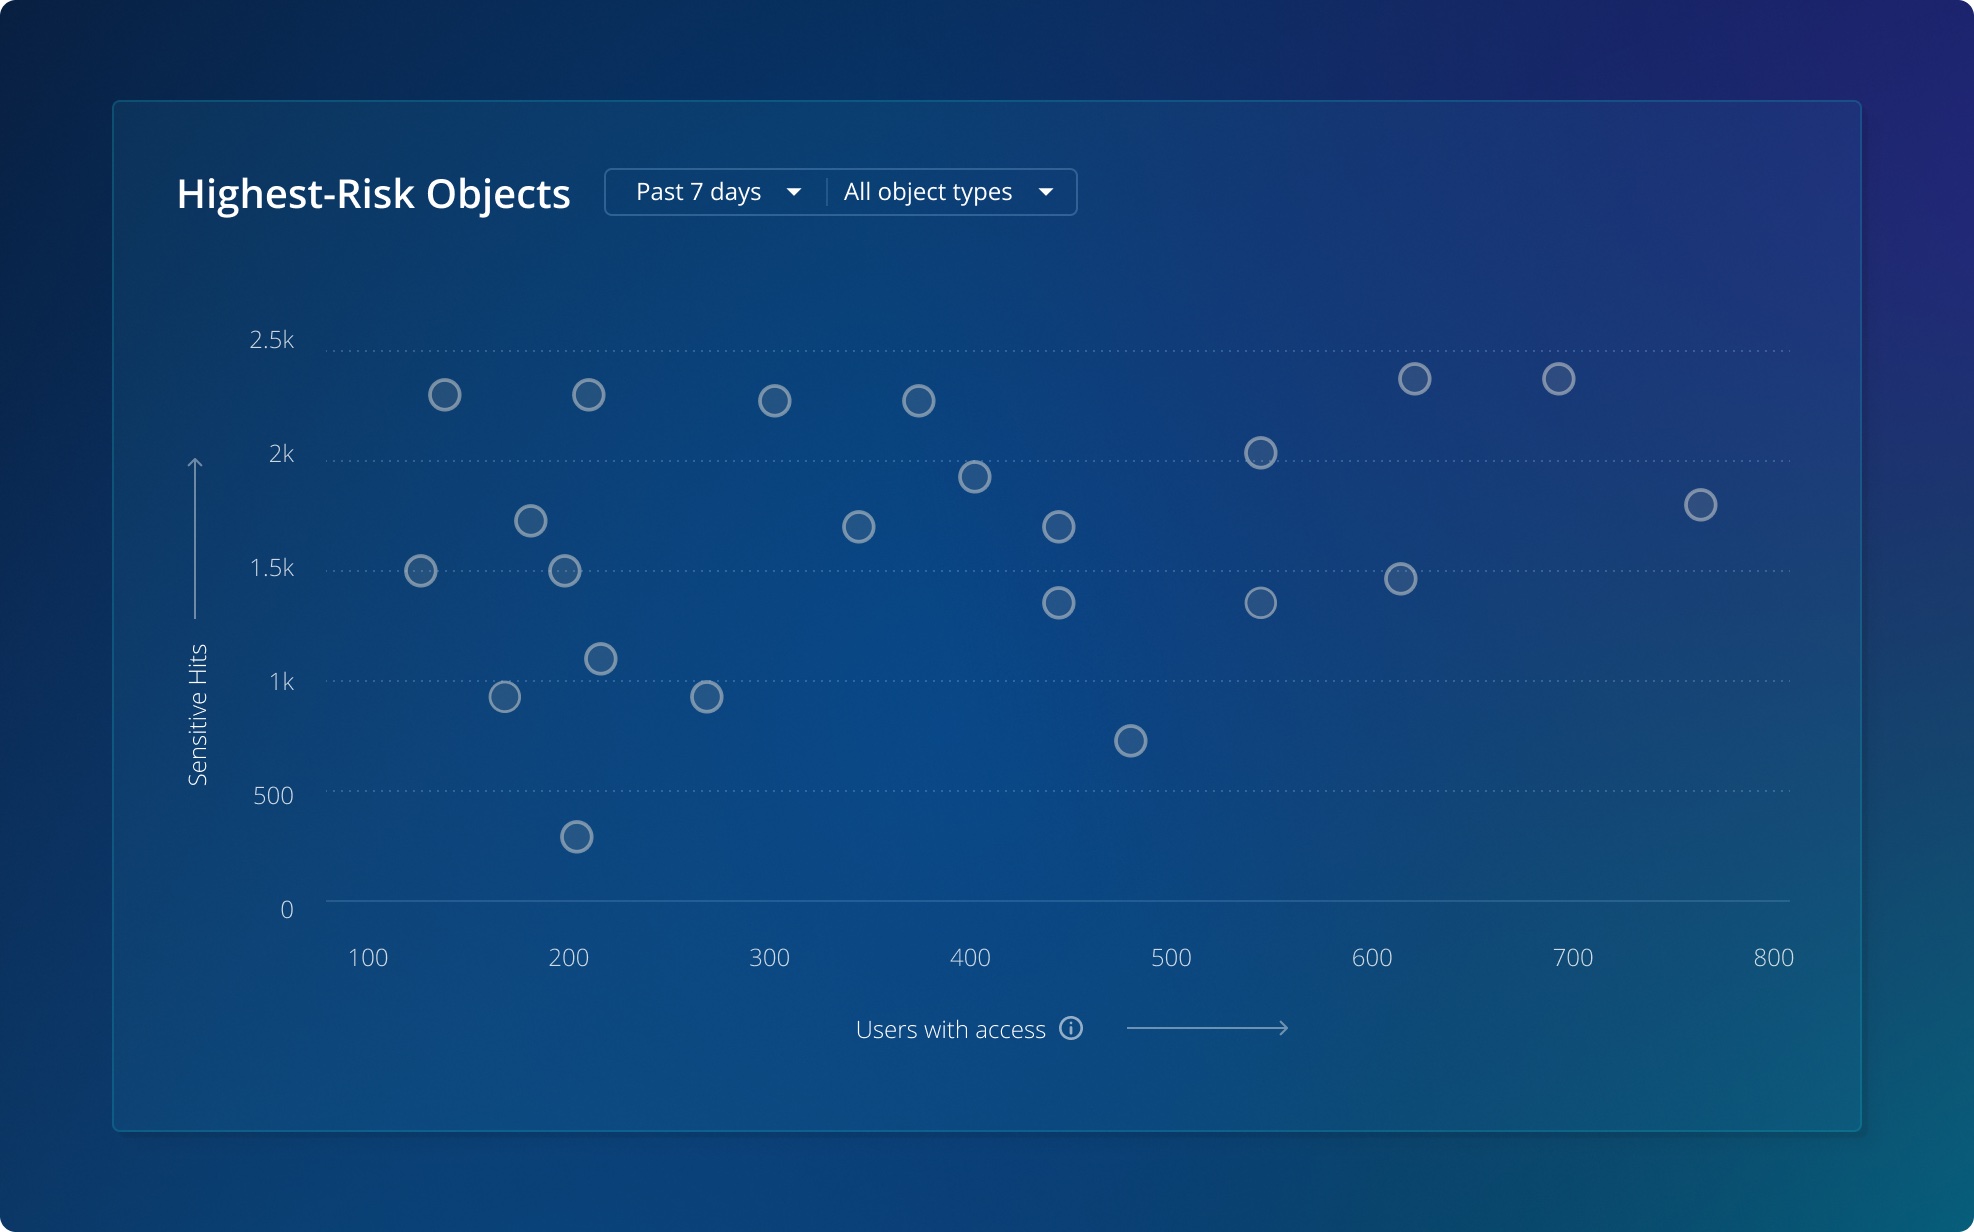
We explored multiple visualization techniques to represent the risk associated with data objects. One of the first options we considered was a heatmap, where colors would represent the level of risk across various objects. While this approach provided a clear visual cue, it lacked the granularity needed to account for both user access and the amount of sensitive data simultaneously. We also explored a bubble chart, thinking the size and color of each bubble could indicate risk. This was visually appealing but proved to be somewhat cluttered and difficult to read when dealing with a large number of objects.
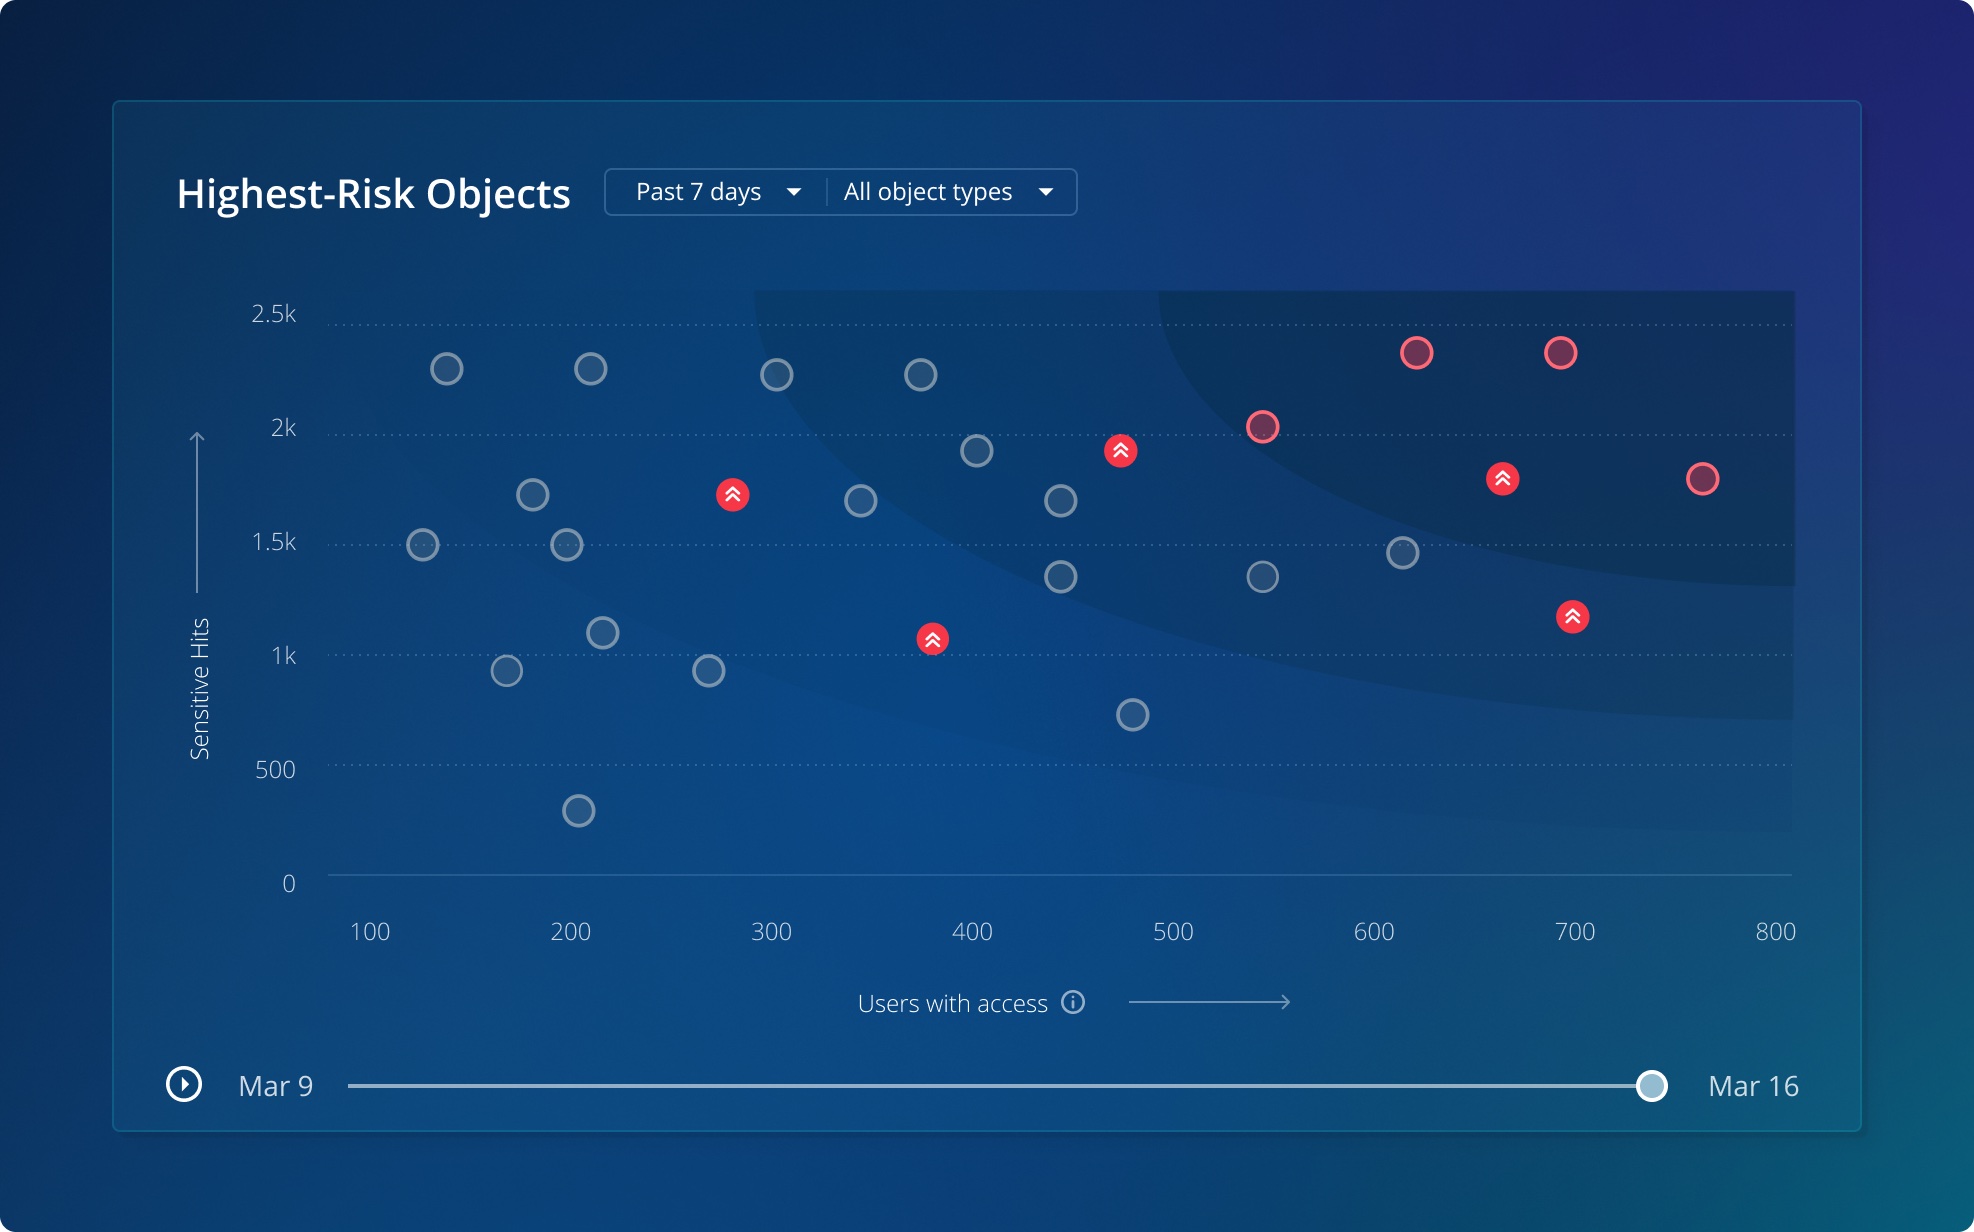
After these explorations, we turned to the scatterplot. The scatterplot stood out because it allowed us to plot two critical metrics — number of users with access and amount of sensitive data — on separate axes, providing a clear and immediate sense of how these two factors interplay to determine risk. Each object could be represented by a circle, with its position on the plot offering a precise indication of its risk level.
This choice allowed us to effectively visualize risk in a way that was both comprehensive and easy to interpret.
Identifying objects growing in risk
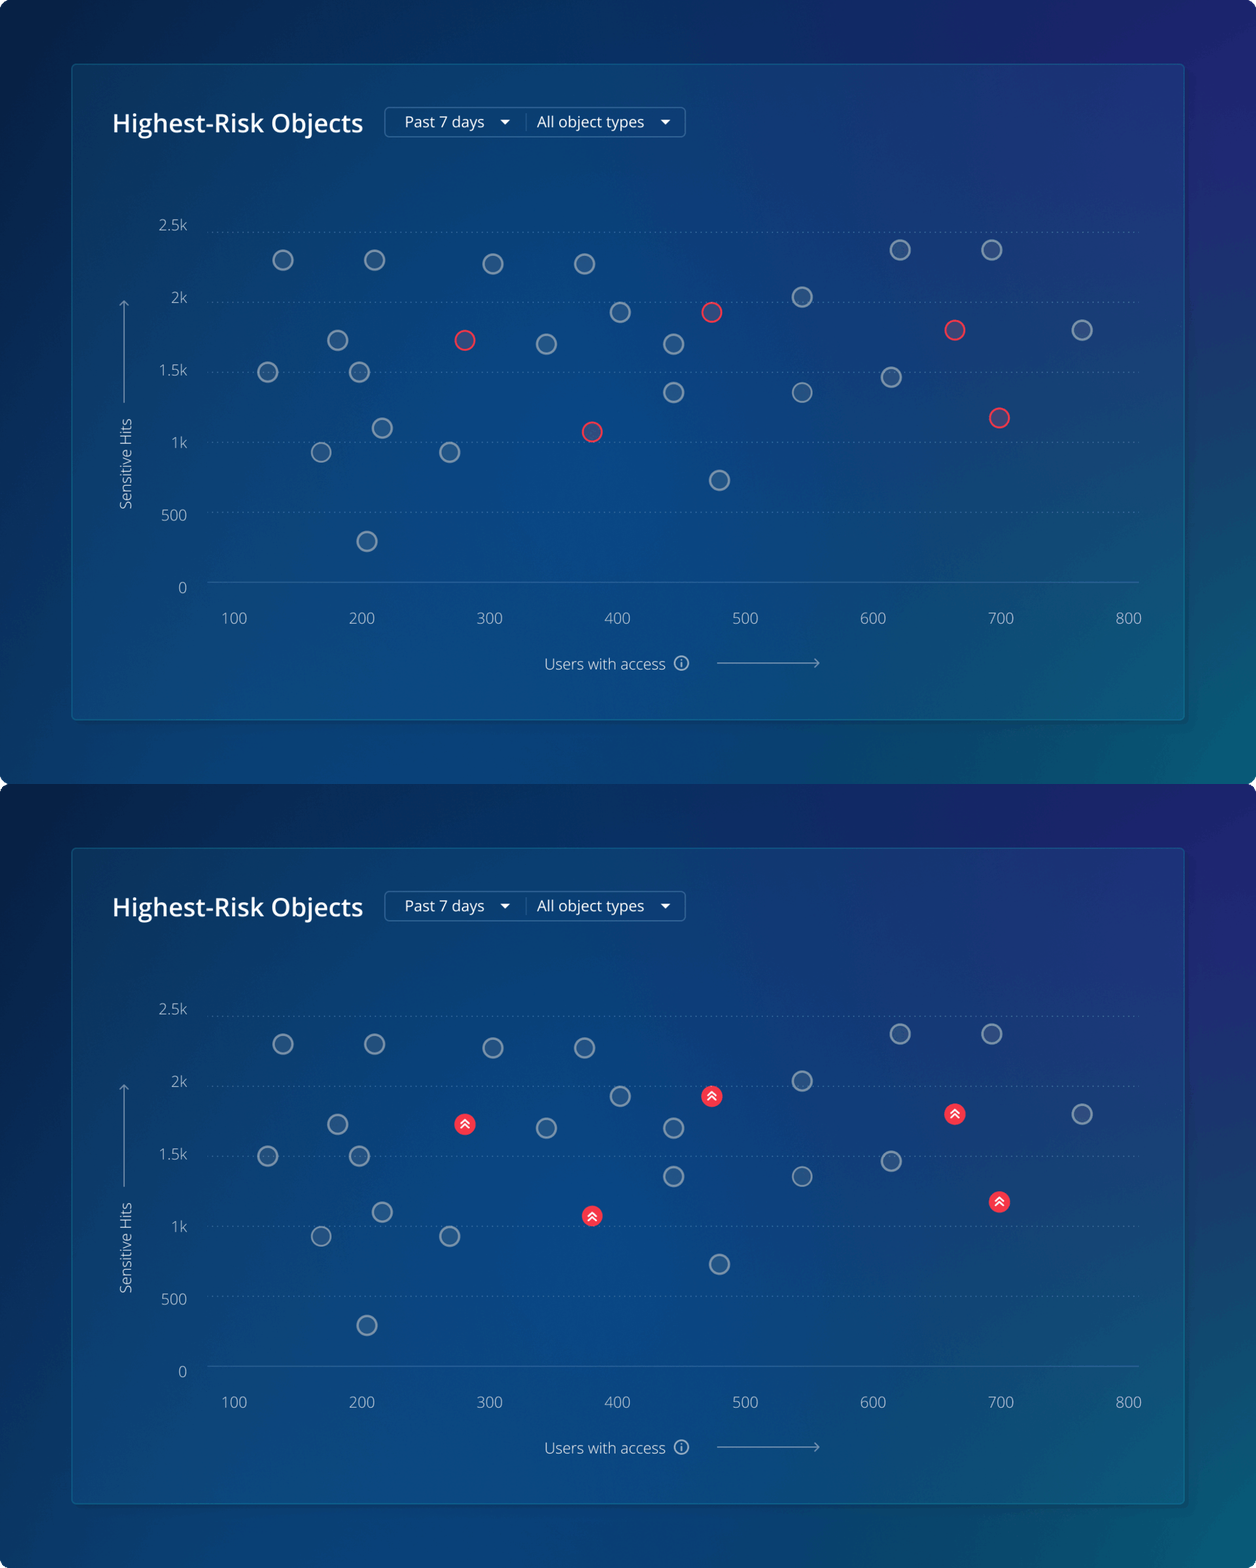
To help users easily spot objects growing in risk over the selected time range, we added a red blinking indicator to the circles representing those objects.
Additionally, we incorporated a timeline at the bottom, which users can drag (or use the play icon) to see how these objects have moved on the plot and grown in risk over time. The timeline provides a temporal context, enabling users to see trends and fluctuations in object risk levels over several days.
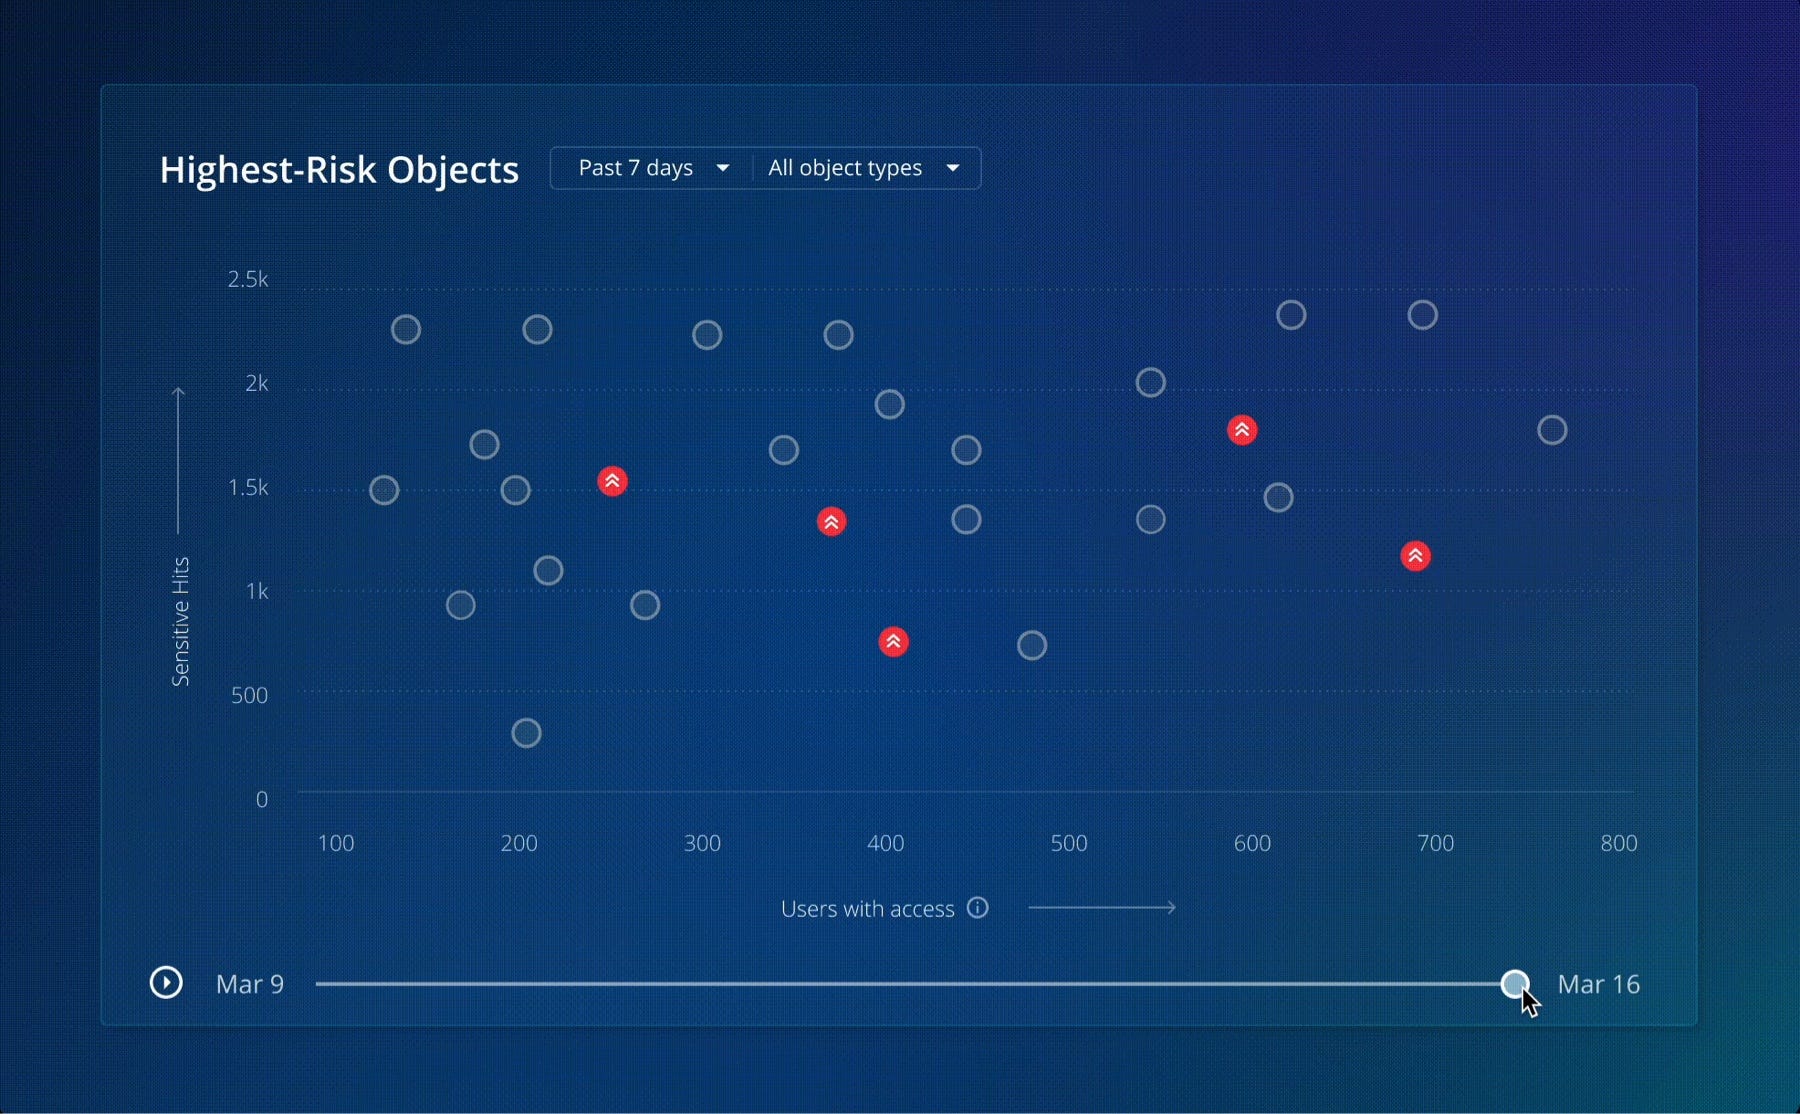
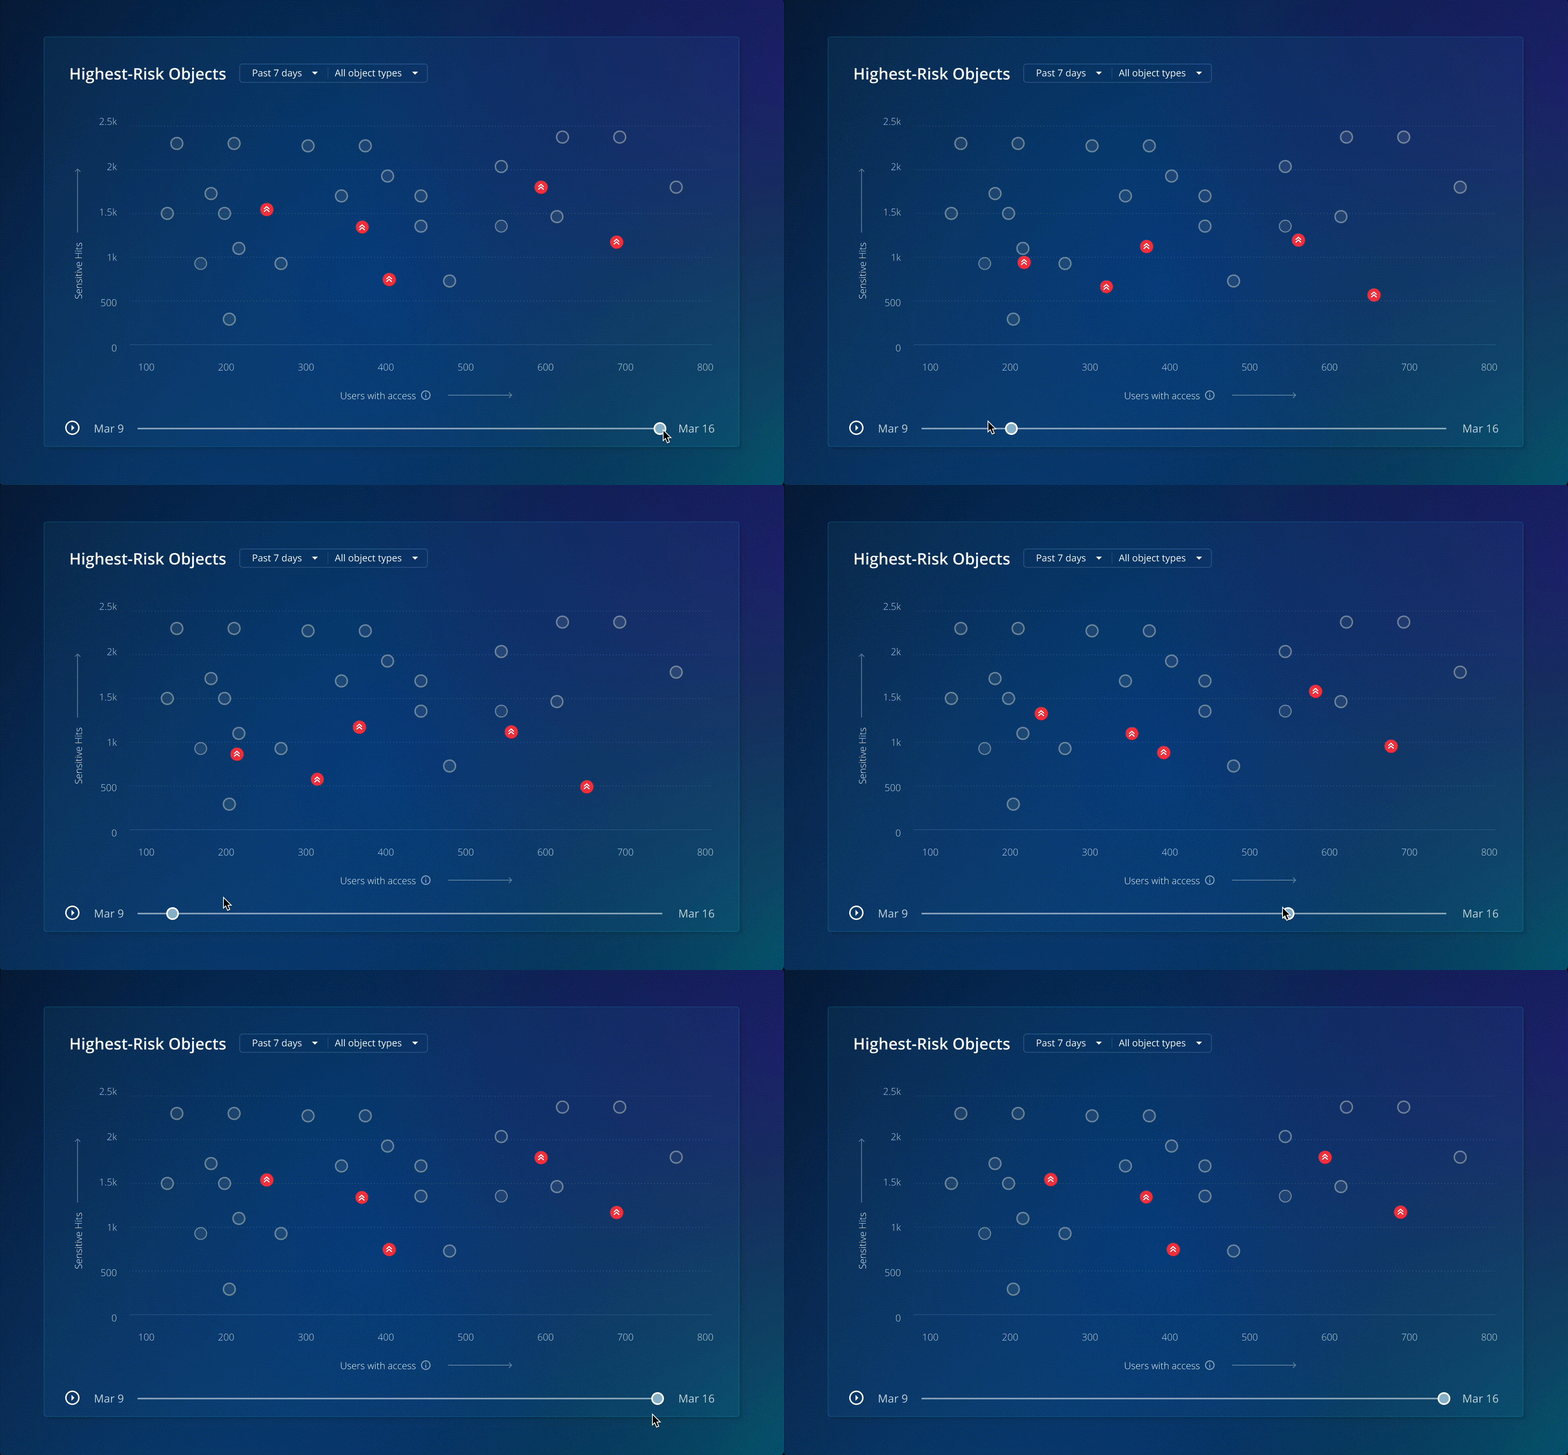
These additions help users understand not just the current state but also the progression of risk — making it easier to identify objects that have recently spiked in risk, even if their current risk level is not yet at the top.
Prioritizing investigations: inspired by the Forrester Wave
When thinking about how to help users prioritize their investigations, I was particularly inspired by the Forrester Wave chart. The chart’s intuitive waves of different intensities, segmenting various vendors, provided a compelling visual approach for highlighting priority areas.
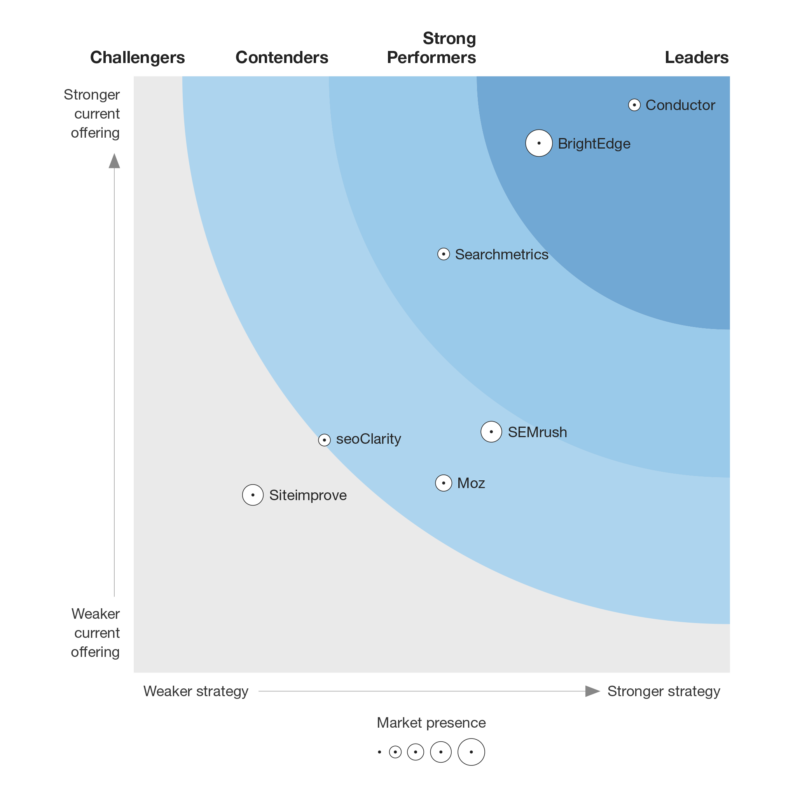
Drawing from this, I added three dynamic regions to the scatterplot, with darker regions indicating objects that should be prioritized due to their higher overall risk. This wave-like segmentation not only guides users to the most critical objects first but also enhances the intuitiveness of the design.
Interactive drill-down capabilities
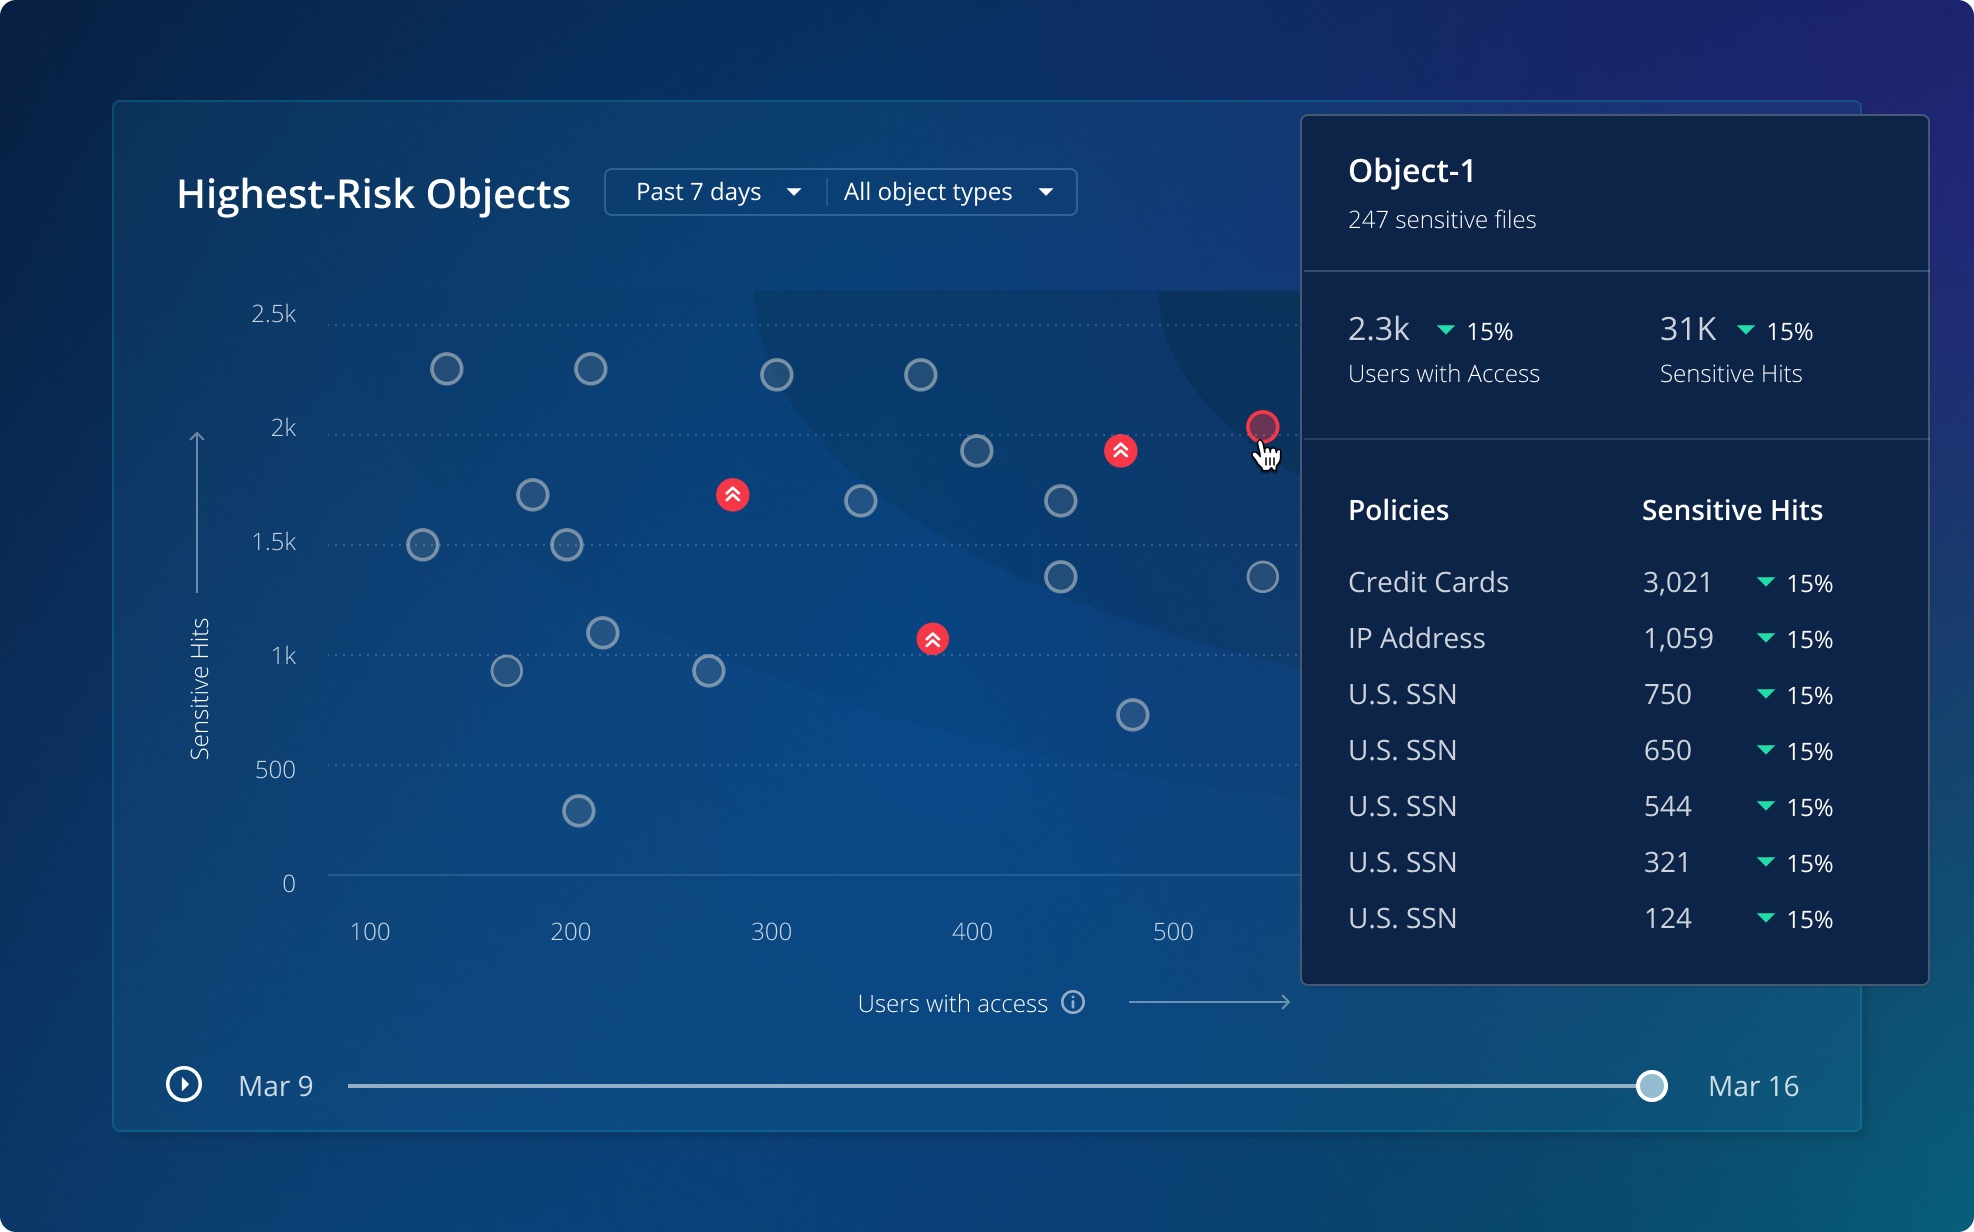
Finally, we enhanced the scatterplot with hover-over and click-through interactions, helping users identify specific objects and drill down into more detailed information as needed.
The final result
After iterating on each of these elements, we arrived at a comprehensive, user-friendly visualization. The final design successfully met our goals, providing users with actionable, dynamic insights to enhance their data security posture.
Reflection
Our approach was validated when we successfully filed a patent for this visualization.
This patent not only recognizes the unique solution we developed but also underscores the impact of thoughtful and well-executed design in the realm of data security. Reflecting on this journey, several key factors stood out:
- Creative Leadership: Our leaders provided a clear vision while allowing us the freedom to explore and identify the best solutions, making a significant difference in the outcome.
- Collaboration: Continuous communication with stakeholders and users ensured that our designs addressed real needs and solved actual problems effectively.
- Clear Goal Setting: Establishing clear objectives before diving into the design process kept us focused on creating visualizations that were intuitive, actionable, and goal-oriented.
- Explorations and Iterative Feedback: The exploration of various design options and the integration of iterative feedback from customers and internal teams were crucial in refining our visualizations into effective tools.
Originally published on Rubrik Design on Medium ↗